Back to return-it.ca
6. Deposits, Refunds and Recovery Rates

6 Deposits, Refunds and Recovery Rates

  • Detailed statistics on the weight and number of containers recovered.
  • Summary of overall units recycled, and the per capita statistics.

6.1 Deposit Change

As the industry-owned not-for-profit stewardship agency, Encorp is responsible for managing B.C.’s beverage container system and implementing deposit increases.

Encorp has been operating B.C.’s beverage container system for 25 years and focused on providing a convenient, efficient and environmentally sustainable network for everyone in B.C. In 2018, Encorp increased its recovery rate to 77.4% and focused on finding ways to improve the recovery rate even further. Diverting beverage containers from landfills, oceans and waterways remains one of Encorp’s highest priorities and has informed its mandate over the years.

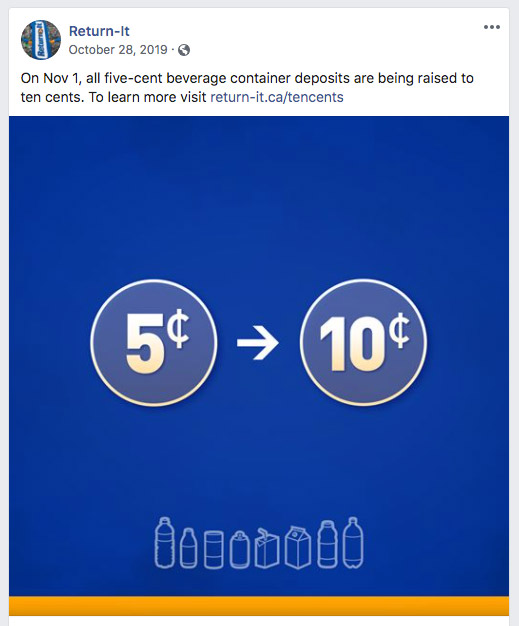
Encorp is aligned with the goals of the B.C. Government to protect our environment and divert even more plastic and other waste from landfills and the ocean. With the intention of providing an additional incentive for consumers to return their beverage containers on November 1st, 2019, Encorp raised the deposit on all non- alcoholic beverage containers registered in the Return-It system (under and including 1 litre) from 5 cents to 10 cents. This deposit increase applies to 80% of the containers in our system – including ready-to-drink beverage containers such as soft drinks, juice, energy and sport drinks, and water.

Slide the table left and right. (Scroll bar is below table.)
Container Type Deposit Refund before Nov1, 2019 Deposit Refund after Nov1, 2019
Aluminum 5.0 cents 10.0 cents
Plastic ≤ 1L 5.0 cents 10.0 cents
Plastic > 1L 20.0 cents 20.0 cents
Polystyrene 5.0 cents 10.0 cents
Glass ≤ 1L 5.0 cents 10.0 cents
Glass > 1L 20.0 cents 20.0 cents
Bi-Metal ≤ 1L 5.0 cents 10.0 cents
Bi-Metal > 1L 20.0 cents 20.0 cents
Bag-In-Box 20.0 cents 20.0 cents
Drink Boxes ≤ 500ml 5.0 cents 10.0 cents
Drink Boxes 500ml - 1L 5.0 cents 10.0 cents
Drink Boxes > 1L 20.0 cents 20.0 cents
Gable Top ≤ 1L 5.0 cents 10.0 cents
Gable Top > 1L 20.0 cents 20.0 cents
Drink Pouches 5.0 cents 10.0 cents

Encorp led the change in deposit rates to ensure the increase was managed efficiently and effectively for all British Columbians and the businesses that were impacted by this change. The announcement was made public during Waste Reduction Week through a press release and to help inform the public of this system change, a short but effective marketing campaign throughout B.C. including TV, radio, online video, newsprint and social media.

Click titles below to view content. View all
TV, Radio, and Pre-Roll

TV

One 15 second TV spot was created to let viewers know about the deposit increase on beverage containers in B.C. The spot was broadcasted on premium sites like Global TV, CTV and CBC across the province.

Total impressions: 2,603,500

Radio

One 10 second radio spot was created to announce the change. The spot ran in the Lower Mainland and Capital Regional District.

Total impressions: 3,894,310

Pre-Roll

15-second spot ran on YouTube, Bell Media, Rogers Network, Corus Entertainment, CBC and Tremor Video.

Total impressions: 442,425

Social Media

Two social media posts were shared through all of our networks and boosted with the objective of informing users of the system change and where they could find more information.

Total Impressions: 1,191,627
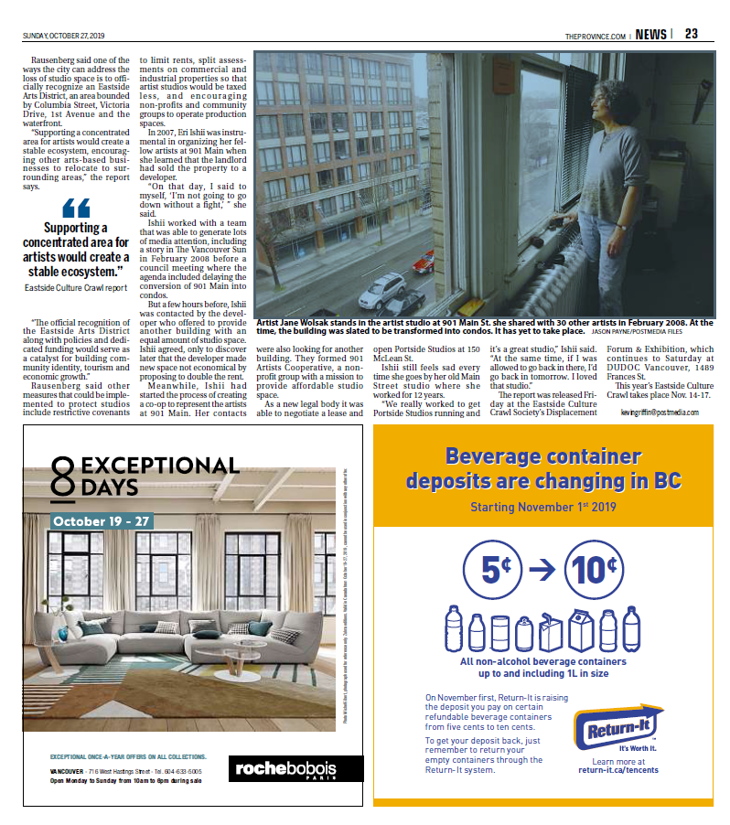
Deposit Change Social Post
Newspaper

8 newspaper insertions across the major Vancouver and Victoria Publications, with 1⁄4 page, full colour ads. Newspapers included Vancouver Sun, The Province, Victoria Times Colonist and Globe & Mail.

Total Impressions: 1,987,000

Newspaper

6.2 Recycling By the Numbers

We prevented over 1 billion containers from going to landfills in 2019, ensuring that they were recycled into useful new materials and products. That’s a big win for British Columbia’s environment.

1 Billion
Containers Collected
78.1 %
Recovery Rate
$ 77,587,390
Deposits Refunded
Slide the table left and right. (Scroll bar is below table.)
Container Type Containers Sold Containers Recovered % Recovery Rate
2019 2018 2019 2018 2019 2018
Aluminum 504,502,096 474,732,423 407,845,669 382,480,812 80.8% 80.6%
Plastic ≤ 1L 449,480,508 461,921,701 328,589,138 332,821,372 73.1% 72.1%
Plastic > 1L 61,743,716 63,350,585 52,873,013 53,531,363 85.6% 84.5%
Plastic Total 511,224,224 525,272,286 381,462,151 386,352,735 74.6% 73.6%
Glass 215,052,960 227,783,448 196,909,028 206,528,437 91.6% 90.7%
Drink Box 91,402,170 97,501,144 52,939,195 55,438,624 57.9% 56.9%
Gable Top 10,179,965 10,520,053 6,951,325 7,339,722 68.3% 69.8%
Bi-Metal 3,794,610 4,402,779 3,187,644 3,650,435 84.0% 82.9%
Bag-In-Box 3,990,418 4,089,087 2,077,558 2,006,502 52.1% 49.1%
Pouches 8,774,917 6,551,183 2,311,962 1,669,204 26.3% 25.5%
Totals 1,348,921,360 1,350,852,403 1,053,684,532 1,045,466,471 78.1% 77.4%

Note: Calculations may show slight variances due to rounding.

Recovery by Weight

In 2019, Encorp Pacific recovered over 93.76 thousand metric tonnes of containers.

87.6%
2019 Recovery Rate by Weight
87.0%
2018 Recovery Rate by Weight
Slide the table left and right. (Scroll bar is below table.)
Type Estimated Weight of
Containers Sold
(KG)
Estimated Weight of
Containers Recovered
(KG)
Recovery
by Weight
%
Aluminum 6,861.2 5,546.5 80.8%
Plastic 13,790.6 10,594.0 76.8%
Glass 82,606.6 75,172.6 91.0%
Polycoat
(Drink Box & Gable Top)
2,552.3 1,729.6 67.8%
Pouches 49.0 12.9 26.3%
Bag-In-Box 933.3 485.9 52.1%
Bi-Metal 272.3 221.5 81.3%
Totals 107,065.3 93,763.0 87.6%

Note: Calculations may show slight variances due to rounding.


6.3 Regional Per Capita Returns

Provincial Totals:
Units Returned 1,053,684,532
Weight Collected (Tonnes) 93,763.0
Per Capita Units Returned 207.8
Per Capita Weight Collected (Kilograms) 18.5

Regional Breakdown:

Slide the table left and right. (Scroll bar is below table.)
Region Name   Aluminum Plastic Glass Polycoat Other Total Jan-Dec
2019
Per Capita
Jan-Dec
2018
Per Capita
Change to
Per Capita
Container Returns
/ Units (000)
Bulkley / Nechako Units
(000)
4,280 3,813 978 544 45 9,660 243.8 249.8 (6.0) dec.
  Tonnes 58.2 100.4 359.7 13.1 4.9 536.3 13.5 kg 14.2 kg  
Cariboo Units
(000)
7,483 7,187 2,032 869 121 17,692 270.3 277.4 (7.1) dec.
  Tonnes 101.8 192.9 749.1 23.2 10.9 1,077.9 16.5 kg 17.8 kg  
Central Coast Units
(000)
288 205 83 37 3 616 172.3 182.1 (9.8) dec.
  Tonnes 3.9 6.3 30.5 0.9 0.4 42.0 11.7 kg 12.3 kg  
Fraser - Fort George Units
(000)
13,114 12,025 3,273 1,752 180 30,344 293.5 297.9 (4.4)
  Tonnes 178.3 315.9 1,219.6 42.3 14.5 1,770.6 17.1 kg 18.2 kg  
Kitimat - Stikine Units
(000)
4,759 4,554 973 634 75 10,995 275.7 262.7 13.0 inc.
  Tonnes 64.7 120.9 369.7 15.8 5.3 576.4 14.5 kg 14.3 kg  
Skeena - Queen Charlotte Units
(000)
2,699 2,945 657 300 53 6,654 344.7 316.0 28.7 inc.
  Tonnes 36.7 76.6 244.0 8.2 2.8 368.3 19.1 kg 19.4 kg  
Northern Rockies Units
(000)
496 821 93 54 4 1,468 296.3 242.4 53.9 inc.
  Tonnes 6.7 20.1 35.9 1.3 0.4 64.4 13.0 kg 11.3 kg  
Peace River Units
(000)
6,743 8,350 1,660 921 103 17,777 265.8 261.8 4.0 inc.
  Tonnes 91.7 216.1 607.8 23.5 5.6 944.7 14.1 kg 14.8 kg  
Capital Regional District Units
(000)
35,538 27,476 18,974 4,448 583 87,019 207.9 207.6 0.3 inc.
  Tonnes 483.3 800.8 7,354.3 140.7 72.3 8,851.4 21.1 kg 22.2 kg  
Cowichan Valley Units
(000)
10,760 8,307 4,011 1,163 188 24,429 270.1 264.0 6.1 inc.
  Tonnes 146.3 232.6 1,563.0 34.2 21.9 1,998.0 22.1 kg 22.1 kg  
Alberni / Clayoquot Units
(000)
4,629 3,816 1,695 458 75 10,673 320.4 308.7 11.7 inc.
  Tonnes 63.0 106.1 636.8 14.0 6.7 826.6 24.8 kg 24.7 kg  
Comox Units
(000)
7,708 6,167 3,495 886 151 18,407 253.5 261.9 (8.4) dec.
  Tonnes 104.8 174.2 1,358.7 27.7 20.2 1,685.6 23.2 kg 24.6 kg  
Mount Waddington Units
(000)
1,878 1,408 414 174 19 3,893 333.7 328.9 4.8 inc.
  Tonnes 25.5 39.6 158.2 4.7 2.7 230.7 19.8 kg 19.8 kg  
Nanaimo Units
(000)
15,845 13,164 7,218 1,839 286 38,352 225.7 224.9 0.8 inc.
  Tonnes 215.5 367.9 2,819.4 54.9 40.8 3,498.5 20.6 kg 21.4 kg  
Strathcona Units
(000)
4,226 3,167 1,508 441 73 9,415 191.8 176.5 15.3 inc.
  Tonnes 57.5 89.3 591.6 13.3 9.5 761.2 15.5 kg 14.9 kg  
Greater Vancouver Units
(000)
168,227 167,780 98,346 29,973 3,619 467,945 173.9 175.5 (1.6) dec.
  Tonnes 2,287.9 4,709.7 37,215.0 871.6 282.6 45,366.8 16.9 kg 17.4 kg  
Fraser Valley Units
(000)
32,404 29,829 10,259 4,695 593 77,780 234.6 241.6 (7.0) dec.
  Tonnes 440.7 818.3 3,831.6 126.4 47.6 5,264.6 15.9 kg 16.9 kg  
Powell River Units
(000)
2,211 1,581 898 240 46 4,976 235.8 228.0 7.8 inc.
  Tonnes 30.1 46.1 346.9 7.6 6.4 437.1 20.7 kg 20.7 kg  
Squamish - Lillooet Units
(000)
4,365 4,195 4,134 524 74 13,292 286.7 296.2 (9.5) dec.
  Tonnes 59.4 116.5 1,555.5 16.2 6.7 1,754.3 37.8 kg 41.1 kg  
Sunshine Coast Units
(000)
2,775 1,798 1,954 325 55 6,907 217.1 216.6 0.5 inc.
  Tonnes 37.7 53.6 769.7 10.8 8.9 880.7 27.7 kg 28.3 kg  
Central Okanagan Units
(000)
19,496 19,363 10,252 2,524 324 51,959 239.2 251.7 (12.5) dec.
  Tonnes 265.1 526.7 4,076.9 73.7 37.8 4,980.2 22.9 kg 24.4 kg  
North Okanagan Units
(000)
10,125 9,983 4,174 1,292 157 25,731 283.2 280.6 2.6 inc.
  Tonnes 137.7 274.7 1,642.5 38.9 19.2 2,113.0 23.3 kg 23.6 kg  
Okanagan - Similkameen Units
(000)
9,743 9,457 5,203 1,098 171 25,672 288.2 288.4 (0.2) dec.
  Tonnes 132.5 259.6 2,095.2 33.2 25.2 2,545.7 28.6 kg 29.0 kg  
Columbia Shuswap Units
(000)
6,072 5,558 2,893 732 99 15,354 275.0 276.1 (1.1) dec.
  Tonnes 82.6 151.7 1,075.9 21.5 12.7 1,344.4 24.1 kg 25.2 kg  
Thompson - Nicola Units
(000)
16,514 16,003 5,644 2,145 255 40,561 277.6 283.0 (5.4) dec.
  Tonnes 224.6 428.5 2,121.3 58.4 26.9 2,859.7 19.6 kg 21.0 kg  
Central Kootenay Units
(000)
5,716 3,991 2,544 688 93 13,032 205.8 204.0 1.8 inc.
  Tonnes 77.7 115.4 962.0 20.2 11.4 1,186.7 18.7 kg 19.3 kg  
East Kootenay Units
(000)
6,592 6,050 2,539 728 81 15,990 247.2 255.6 (8.4) dec.
  Tonnes 89.6 164.3 990.6 21.4 9.4 1,275.3 19.7 kg 20.7 kg  
Kootenay Boundary Units
(000)
3,160 2,469 1,005 407 51 7,092 212.1 210.8 1.3 inc.
  Tonnes 43.0 69.2 391.2 11.9 6.6 521.9 15.6 kg 15.8 kg  
Total Units Units
(000)
407,846 381,462 196,909 59,891 7,577 1,053,685 207.8 209.4 (1.6) dec.
Total kg Tonnes 5,546.5 10,594.0 75,172.6 1,729.6 720.3 93,763.0 18.5 kg 19.2 kg  

Note: Calculations may show slight variances due to rounding.